Extended description using HTML details and summary
Extended Description
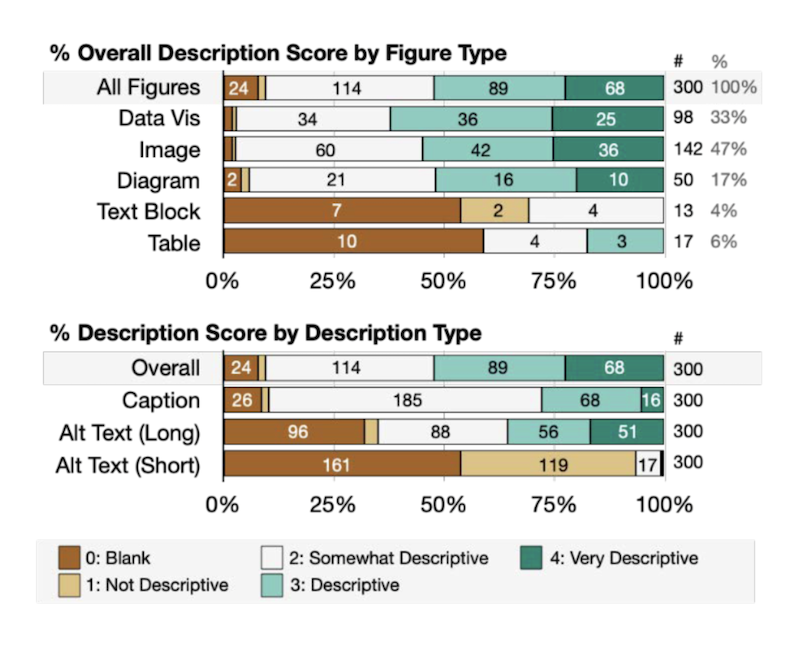
Extended description for top chart:
Overall around 50% of figure descriptions (considering the alt text and captions together) scored 3 or above, and around 50% of figures scored 2 or below. Of figure types, Data Visualizations receive the highest percentage of 3’s and 4’s followed by images, diagrams, then tables (no 4’s) and text blocks (no 3’s or 4’s). The chart also shows the percentage of figures that contain each element type, and indicates that 33% of figures have a visualization, 47% have an image, 17% have a diagram, 4% have a text block and 6% have a table. Full data table in supplemental material.
Table of top Figure Data
| Blank | Not Descriptive | Somewhat Descriptive | Descriptive | Very Descriptive | # | % | |
|---|---|---|---|---|---|---|---|
| All Figures | 24 | very small % | 114 | 89 | 68 | 300 | 100% |
| Data Vis | very small % | very small % | 34 | 36 | 25 | 98 | 33% |
| Image | very small % | very small % | 60 | 42 | 36 | 142 | 47% |
| Diagram | 2 | very small % | 21 | 16 | 10 | 50 | 17% |
| Text Block | 7 | 2 | 4 | 13 | 4% | ||
| Table | 10 | 4 | 3 | 17 | 6% |
Extended description for bottom chart:
The alt text (long) alone was more likely to receive a high score than the caption alone (51 alt text’s received a 4, and only 16 captions received a 4). In contrast, the alt text short field received a majority of either 0 (161 figures), or 1 (119 figures). Full data table in supplemental material.
Table of bottom Figure Data
| Blank | Not Descriptive | Somewhat Descriptive | Descriptive | Very Descriptive | # | |
|---|---|---|---|---|---|---|
| Overall | 24 | very small % | 114 | 89 | 68 | 300 |
| Caption | 26 | very small % | 185 | 68 | 16 | 300 |
| Alt Text (Long) | 96 | very small % | 88 | 56 | 51 | 300 |
| Alt Text (Short) | 161 | 119 | 17 | 300 |