Extended description using HTML details and summary

The top chart plots the percentage of each score (0 blank, 1 descriptive, 2 somewhat descriptive, 3 descriptive and 4 very descriptive), for each type of figure (all figures, data visualizations, images, diagrams, text blocks, and tables). The bottom chart shows the percentage of descriptions with each score for both overall descriptions, and then broken down by captions, alt text (long field) and alt text (short field).

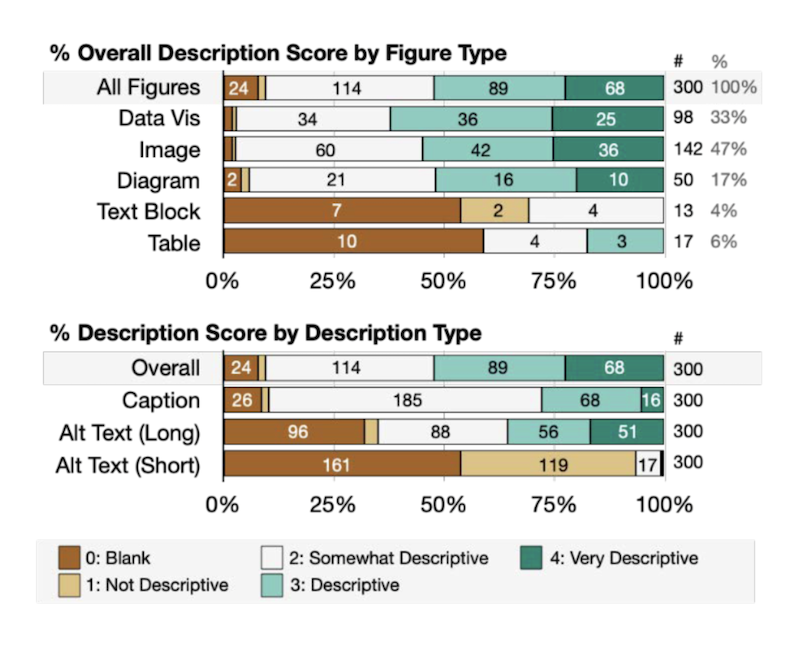
Figure 2. Two stacked bar charts depicting the percentage of overall scores by figure type (top) and the percent description scores by description type (bottom). Each figure may have more than one figure type (e.g., Data Visualization, and Image). N=300